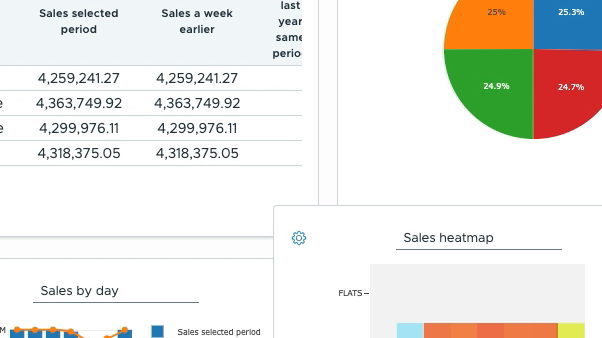
Workspaces Designed for Decisions, Not Slides

Combine visual charts with live input cells so business managers and operators can review metrics and update records on screen.

Action-Oriented

Built for Knobs & Execution

Focus on concrete daily decisions rather than static vanity metrics. Combine inventory levels, pending orders, and reorder triggers into functional layouts built for operational managers.

  • Clear visual hierarchy for daily priorities
  • Focused KPI summaries without clutter
  • Designed for rapid team decision-making

Flexible Layouts

Drag-and-Drop Canvas

Arrange compact charts, data tables, and interactive filters on a flexible canvas. Custom-tailor views for specific roles across store floors, logistics, and management.

  • Intuitive layout design tools
  • Responsive components for screens and tablets
  • Reusable component templates
Unified Datasets

Multi-Source Data Fusion

Join transaction logs, loyalty records, and operational spreadsheets inside a single report card without writing complex join queries.

  • Seamless blending across multiple sources
  • Real-time cross-filtering across charts
  • Consistent metrics across departments
Advanced Calculations

Post-SQL Formula Engine

Apply Python and Pandas style formulas directly to aggregated table rows. Compute percentage shares, running totals, and target variances cleanly without database clutter.

  • Fast row-level calculations in view
  • Flexible statistical helpers
  • Dynamic group summaries
Direct Write-Back

Interactive Input Cells

Edit inventory counts, approve purchase quantities, and add order notes directly inside interactive data cells. Push updates back to core systems instantly.

  • Inline cell editing on live tables
  • Immediate validation checks
  • Direct link to action triggers
Governed Access

Catalog Security Inheritance

Inherit row-level security policies automatically across every card and filter. Store managers see only their branch numbers while regional leads review total network performance.

  • Automatic tenant context filtering
  • Role-based column visibility
  • Centralized data governance

Put Your Data to Work

Choose the path that fits your operational needs—start self-serve or consult our team.

Explore Platform Features

See how Automat BI automates data pipelines, demand forecasting, and operational write-back.

Automat BI platform workspace dashboard